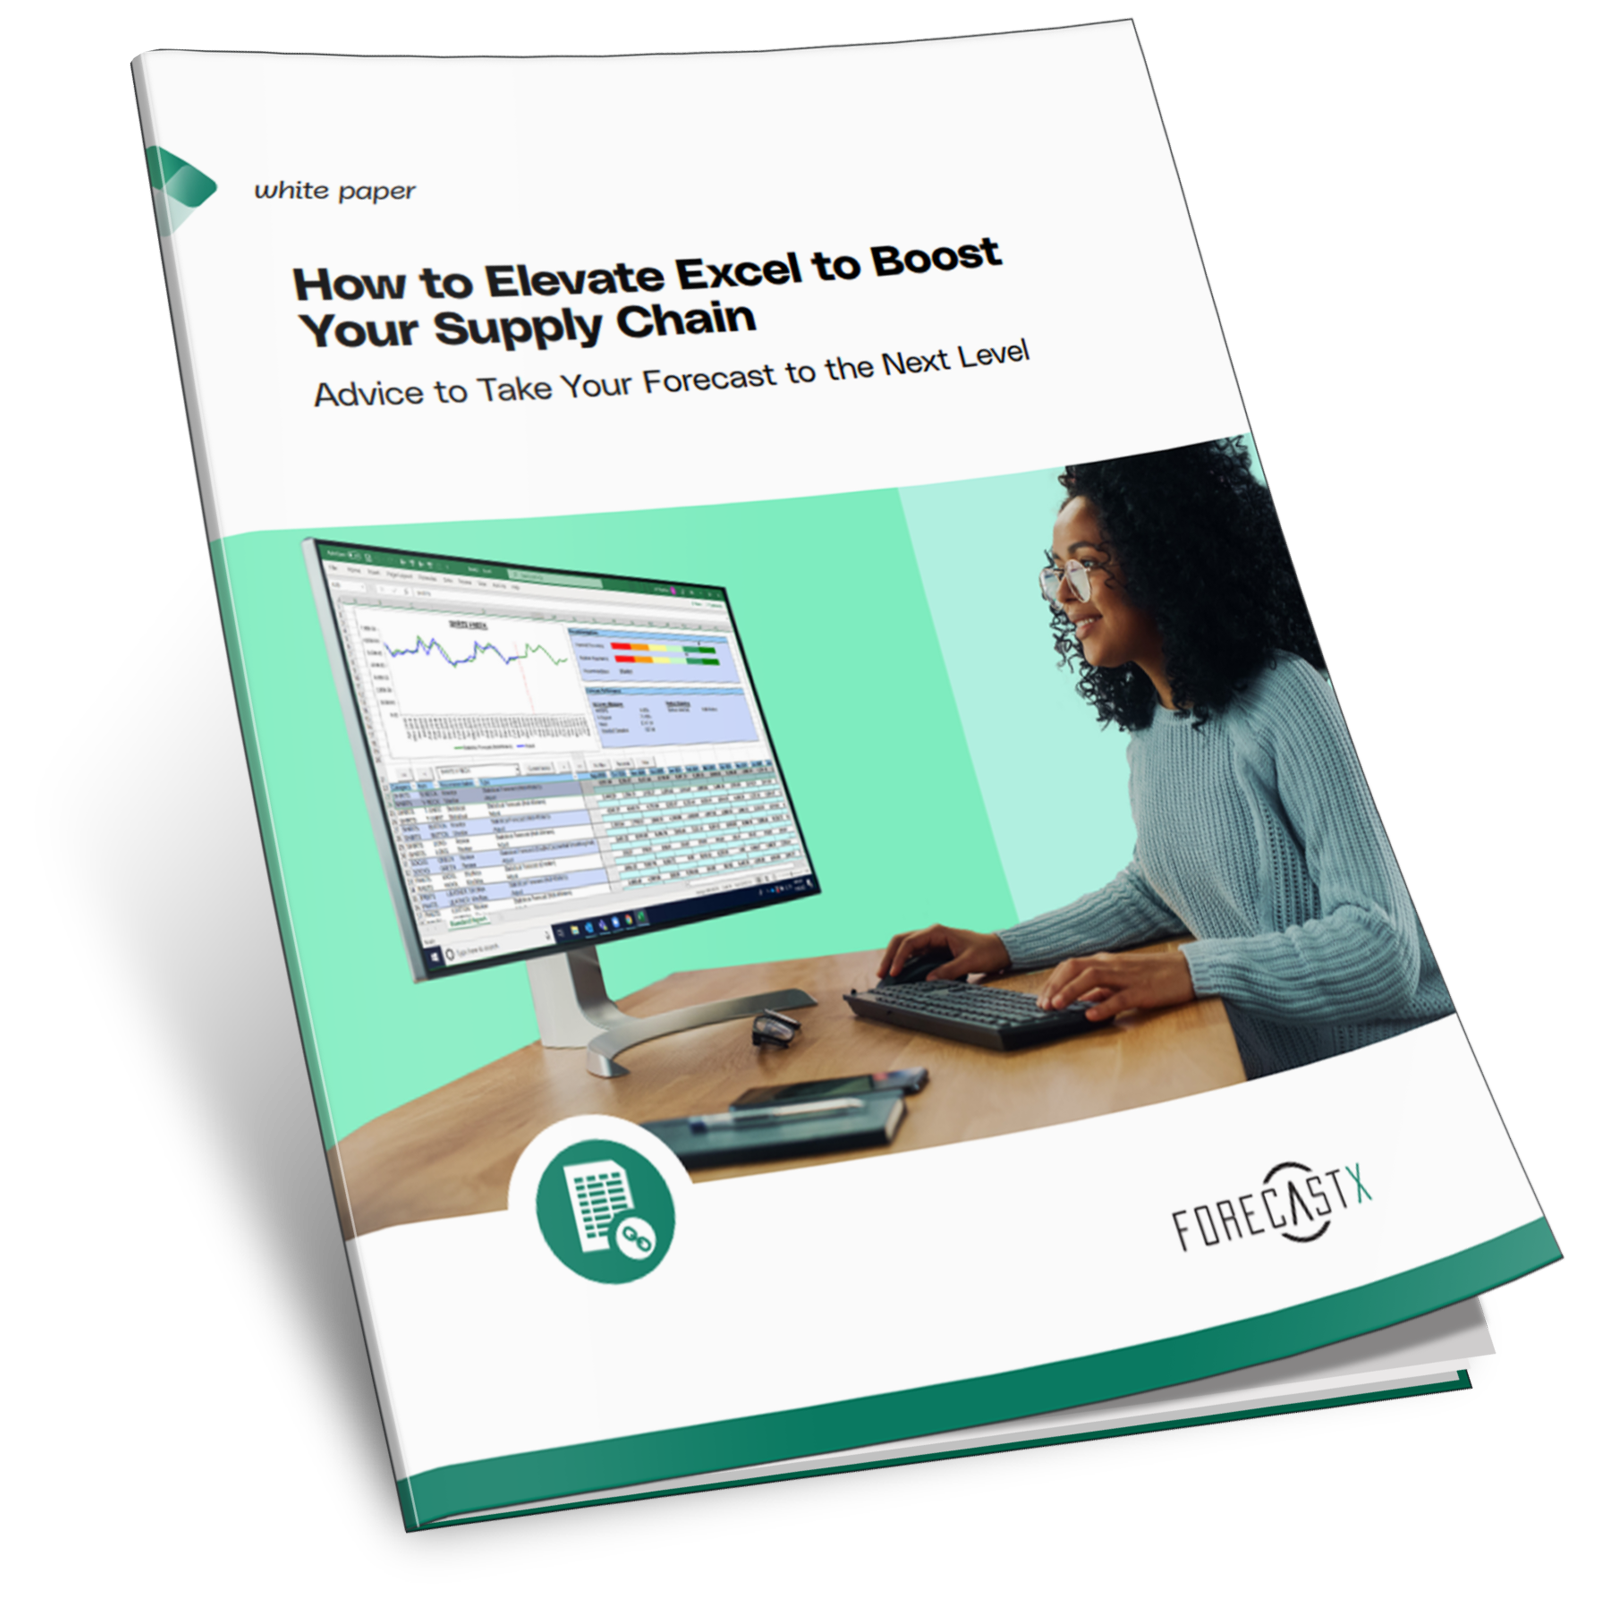
White Paper
Powerful Forecasting
Made Easy in Excel.
For $99 / month get one-click forecasting that delivers unparalleled statistical power
combined with the infinite flexibility of Excel.
Schedule a Demo
One-click forecasting that delivers unparalleled statistical power combined with the infinite flexibility of Excel
Your Forecast in Minutes
No need to spend hours on data cleansing and formatting. Just add your data to Excel and create your forecast in one click. ForecastX automatically interprets your data and selects the best forecasting method to instantly create an accurate forecast.
 Automatic best-fit modeling
 Apply flexible group forecasting
  Manage inventory levels
  Optimize safety stock
  Measure impact of events
  Model NPIs
 Focus with ABC analysis
  Collaborate across teams
Key Capabilities
Forecasting is a collective endeavor and ForecastX helps you manage that by enabling collaboration with both internal and external stakeholders. With the click of a mouse, you can now turn good forecasts into better forecasts that people can relate and commit to.
- Plan with Confidence
Our best-fit-algorithm PROCAST is the most accurate statistical forecasting solution and consistently outperforms alternate solutions. Your bottom line will thank us.
- Work as a Team
Provide your team the ability to collaborate with key internal and external stakeholders, make changes at any level of detail and consolidate the results.
- Better Decisions, Faster
Fine-tune the marketing mix to focus on the most profitable events and promotions for your company. Know exactly which promotions are profitable, now.
- The ABCs of Analysis (Pareto)
Group products based on their importance and helps focus your attention on the areas that will most influence your bottom line.
- Plan for Success
Utilize sales data from similar products when introducing new ones to analyze patterns and create an accurate baseline forecast for your new product.
- Shave Inventory Cost
Turn inventory into cash, optimize safety stock, and develop replenishment plans based on your inventory parameters. Let make your customers happy, together!
- Advanced Reporting
Export and share your results using powerful and versatile reporting. Choose from a range of report types, and easily integrate your forecast with any ERP system.
- Measure the Impact
know exactly which promotions were profitable in the past and start planning for changes in future demand.


How It Works
Experience the power of ForecastX in this short video overview as we take you on a quick tour of its key features and capabilities. Want to see more, visit our library of demos.
ForecastX at a Glance
Reduce Forecast Error
Inventory Savings
Annual Forecast Accuracy
Select Your Pricing Plan
ForecastX Lite$59/month
Get familiar with the ins and outs of this simple to use Excel plugin.
 ProCast™ Expert Selection
 Batch Forecasting
 25+ Statistical Methods
 50+ Statistical Measures
 Event Modeling
 Much, much more!
ForecastX$99/month
User-friendly, Excel plugin to take your planning to the next level!
 Multi-level Hierarchy Management
 On-fly re-calculations
 ABC Analysis
 Consensus Planning
 New product forecasting
 Conversion Factors
 Advanced reporting
 Customer co-development
 That’s just the beginning!

“It is no longer ‘I think’ or ‘I feel’, now we have accurate data to validate our decisions.”
Luke Marietta, S&OP Manager
