Our Event Model is designed to enhance your data analysis and allows you to take promotions and other events into account as you develop your forecasts. Now you can go beyond analyzing the trend and seasonality contained in your historical data by assessing the impact of promotions on your historical and future demand.
Companies conduct various types of promotions. At any given moment your organization may use push and pull types of promotions at various times throughout the year. In general, push promotions are designed to push the merchandise off the shelves through increased customer awareness, whereas pull promotions are designed to attract customer's attention by means of an incentive that causes them to purchase the product.
To use the Event Model forecasting technique:
- Click on
 and open the Tutorial_Event_Modeling.xls file.
Note: The Tutorial_Event_Modeling.xls file is a data example to demonstrate how the Event Model method is used. For your company’s purposes, you will have your own data available. - Click on the Base Case sheet.
- Click in a cell containing data and open ForecastX by clicking on
 . The Event Model Forecasting technique displays. Events used for event modeling no longer need to be numerical; they can be labels. Also, if they are numerical values representing events, then numbers used for the events do not need to be consecutive.
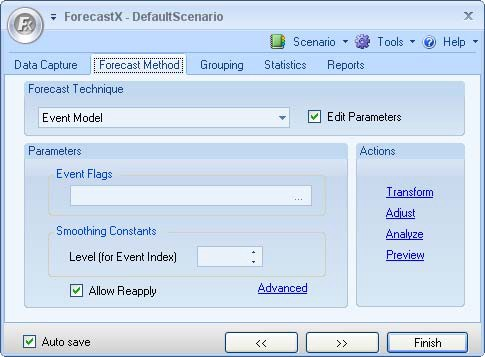
- Select Edit parameters to activate the Event Model’s parameters.
- Click on the Event Flags text box to select a range. The Event Modeling forecast method supports multiple set of event flags for the same data set. The Wizard dialog displays.
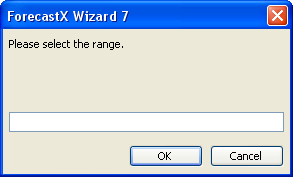
- Click OK.
- In the Smoothing Constants area, type in a Level.
- Select Allow Reapply to enable the Reapply Event Modeling feature. This feature allows you to click on the Reapply Event button on the ForecastX. Null values will be interpreted as zeroes from the dataset. The Standard report of the Event Modeling Forecast can be reapplied.
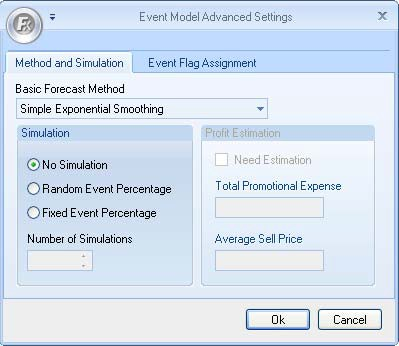
The table below details what each feature means in the Method and Method and Simulation tab.
Feature Description Basic Forecast Method Select the forecast method used to Forecast the bottom line of the Event Model. No Simulation Do not use the simulation. Random Event Percentage Use the simulation, and the percentage of each event in the simulation is random. Fixed Event Percentage Use the simulation, and the percentage of each event in the simulation is fixed, which equals the percentage of events in the given event flags. Number of Simulations Enter the number of simulations. Each simulation creates one set of events to create the simulated forecasted values. Need Estimation Select this option to activate the profit estimation function, which calculates the profit by the subtraction of the total promotional expense from the total revenue. Total Promotional Expense Used to estimate profit. Average Sell Price Used to estimate the revenue, which is calculated by the multiplication of the average sell price and the total sales. - Click on the Advanced link. The Advanced Event Model window displays.
- Click on the Event Flag Assignment tab.
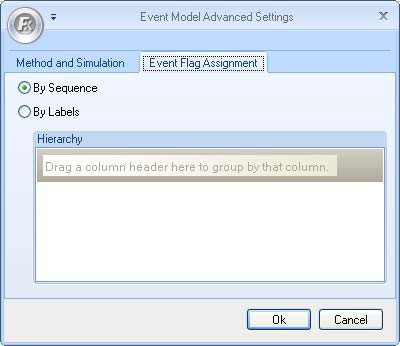
- Select either By Sequence or By Labels.
Event Flag Assignment Description By Sequence The first Event Series is assigned to the first series, and the second event flags is assigned to the second series. If there are not enough Event Series, then the first event is reused, the second event is reused thereafter, etc. By Labels Specify one or more label fields to link the Event Series and data series. You can select the hierarchy of the labels for the event flag by dragging and dropping the ByLabels column headers.
Note: The number of labels available for this feature is dependent on the ForecastX Edition you are running, to verify your tools capacity see Software Editions 12.
- Click OK.
- Click Finish.
On the Audit Report, you see the effect of the events on Newspaper Sales and how your error measurements improve. The Audit Trail report provides you with additional statistical data, including the event lift factors.