Holt-Winters is an Exponential Smoothing technique that incorporates growth and Seasonality into the forecast. Holt-Winters does this by producing Seasonal lift factors for each seasonal period. The Seasonal indices are displayed in the Audit Trail report. This approach is most useful when the seasonal component and the trend component are changing at different paces over time.
If the Historical data is known to change rapidly, large smoothing constants should be used. For stable, naturally consistent data, the smoothing constants should be closer to zero. In either case, ForecastX™ automatically optimizes the parameters for you if you choose not to specify them.
To use the Holt-Winters forecasting method:
- Click on
 and open the ForecastingExamples.xls file.
Note: The ForecastingExamples.xls file is a data example to demonstrate how the Holt-Winters method is used. For your company’s purposes, you will have your own data available. - Click on the Holt-Winters sheet.
- Click in a cell containing data and open ForecastX by clicking on
 . The Data capture window is displayed.
 - Click on the Forecast Method tab, the following window is displayed.
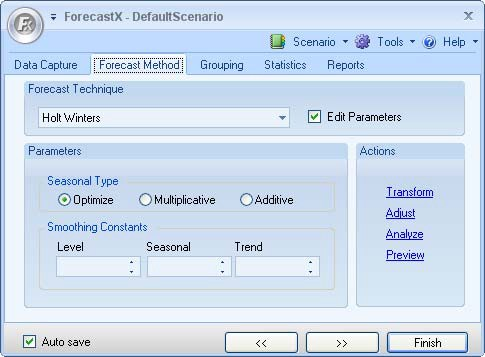
- Select Edit parameters to activate Holt-Winter’s Note: The alpha, beta and gamma parameters have all been renamed Level, Seasonal and Trend throughout the application to reflect more easily what they represent.
- In the Parameters area, select the Seasonal Type and Smoothing Constants. The following table detail what each parameter means.
Parameter Description Seasonal Type Indicate which type of Holt-Winters to use.
- Optimize - the optimal Seasonality is determined for you.
- Multiplicative - Multiplicative Holt-Winters.
- Additive - Additive Holt-WintersSmoothing Constants - Level - level of smoothing.
- Seasonal - Seasonal parameter.
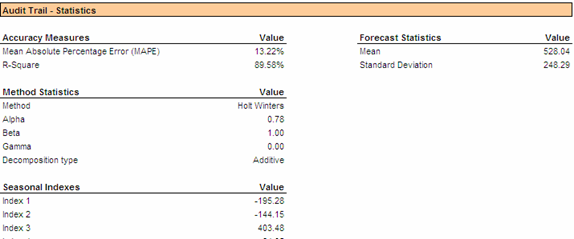
- Trend - trend parameter. - On the Reports tab, click on Audit Trail report to validate the generated report’s accuracy.
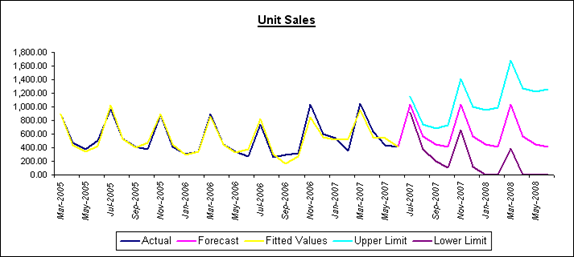
- On the Executive tab, check the Upper Limit and Lower Limit options; this displays the confidence limits of your Forecast.
- Click Finish.
After running the Forecast, ForecastX creates a graph and a table with the Seasonal indices and Smoothing Constants. The graph enables you to quickly assess the Trend and Seasonality of your data by depicting the peaks and valleys of the sales.
The Audit Trail statistics display an accurate Forecast. In addition, the Audit Trail report displays Smoothing Constants, Level and Trend, as well as the Seasonal indices. You can use this detail to learn about the Trends and Seasonality of your data.