The Grouping tab allows users to Data Cleansing group items together by common attributes and then produce forecasts at a group level using those attributes. This enables more accurate forecasts by running at the more stable group levels, while also enabling planners & collaborators to offer feedback for many items at a time, or in total.
ForecastX supports Top Down and Bottom Up forecasting. Top Down forecasts run statistically at the highest levels, and then that high-level forecast is divided (or “allocated”) based on each item and item family’s contributions to the whole. Bottom Up forecasts run at the lowest level of data, and those forecasts are then summed up to the group levels. In general, Top Down forecasts offer superior forecast accuracy at higher levels, but do not have the same individual focus on each item that a Bottom Up forecast would have.
Using the same spreadsheet, “ForecastXTrainingSet.xls” and the “Group Forecasting” worksheet, open ForecastX.
- Click the ForecastX icon, and the “Data Capture” screen appears, click on the “Grouping” tab.
- Under Group By, check the “Group Forecast” box.
- For Allocation Type, check the “Top Down” option.
- In the hierarchy section, click on the Region label and drag it to the gray area on top of the headers. Do the same for the Category label.
Note: The Standard Edition of ForecastX will only allow one label at the group levels. - Click Finish - when the report is done, click View Output.
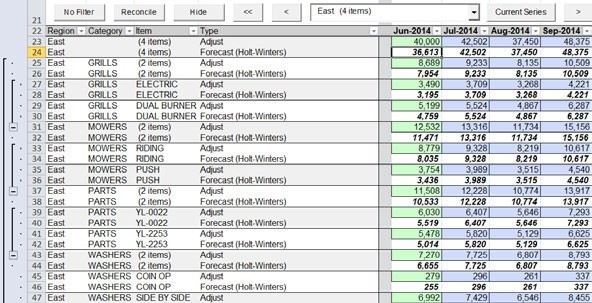
Notice that ForecastX created forecasts for each different Region and under each region a total for each Category as well as the detail level. You can expand the tree using the “+” sign to the left of the worksheet.
In the Premium edition, changes can be made to your forecast at any level and the On- Fly Rebalance button in the ForecastX toolbar can sync your changes with the other levels. For example, change the forecast for the first period by typing in new values into the Adjust line (this would be cell AC23) of the East group and type in 35000, then click on the On-Fly rebalance button and click OK. The new forecast value for the East Region has been distributed to the items below it.