Stepwise Regression is used to determine the relevant Explanatory Variables from a set of Independent Variables. Explanatory Variables are the variables most useful to explain the dependent variable.
Explanatory variables are typically included in the final Regression model. When the number of independent variables is extremely large, it makes it impossible for common regression models to compute and determine all of the explanatory variables. In such cases, Stepwise Regression is used to determine explanatory variables. There are three types of Stepwise Regression:
Stepwise Forward Regression
From all the explanatory or independent variables, this method selects the one with the highest correlation with Y, the dependent variable. It then determines the Residuals, or Errors, that result from this regression and consider these residuals a new set of Y values or dependent variables. From the remaining independent variables, it selects the one that correlates most highly with these residuals. (Remember to consider these residuals as a new set of dependent values.) Continue this process until no remaining explanatory or independent variable has a significant relationship with the last set of variables.
Note: The term Error in forecasting is often interchangeable with Residual. Both refer to the difference between the forecasted and actual values. The Error or Residual Opinion Line can be added to a report by selecting the ‘Error’ option from the Opinions section.
Stepwise Backward Repression
This method starts with a regression that includes all of the variables and weeds out the variable that are least significant in the equation, as measured by the t-test. When this variable is removed, another regression is performed to determine the next variable to be removed. This process is repeated until the most significant variable remains.
Stepwise Forward with a Backward Look Regression
Combining the advantages of Stepwise Forward Regression and Step Backward Regression, this method is the most powerful and the most popular of the three. This method works through an iterative process to determine the best explanatory variables. When it is no longer possible to find any new variable that contributes to the R-Squared value, or if no variable needs to be removed, the iterative process stops.
To use the Stepwise forecasting technique:
- Click on
 and open the ForecastingExamples.xls file.
Note: The ForecastingExamples.xls file is a data example to demonstrate how the Stepwise method is used. For your company’s purposes, you will have your own data available. - Click the Stepwise Regression tab at the bottom of the Excel sheet to select the example spreadsheet.
- Click in a cell containing data and open ForecastX™ by clicking on
 . ForecastX displays.
 - Click on the Forecast Method tab.
- In the Forecast Technique area, scroll through the list of methods and select Stepwise. The Stepwise Forecasting technique displays.
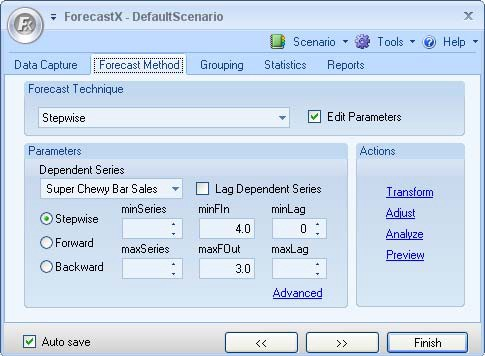
- Select Edit parameters to activate Stepwise’s parameters.
- In the Parameters area, configure the options The table below details what each option means.
Parameter Description Dependent Series Selects the dependent Series of the model. Stepwise/ Backward/ Forward Indicates the type of model. minSeries Indicates the minimum number of the independent variables that will include in the model. maxSeries Indicates the maximum number of the independent variables that will include in the model. minFIn Indicates the minimum F-value of an independent variable that can be allowed into the model. maxFOut Indicates the maximum F-value of an independent variable that should be removed from the model. minLag Indicates the minimum lag used in the model. maxLag Indicates the maximum possible lag in the model. LagDep Includes a lagged dependent variable in the model. - On the Reports tab, select Audit Trail report.
- Click Finish.
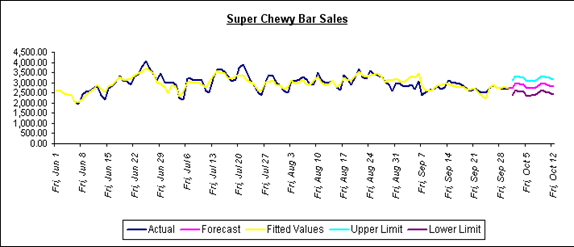
The graph you produce with ForecastX shows you a smoothed forecast of sales over the next few periods.
If you needed more detail, you could scroll down in the report to find the statistics.
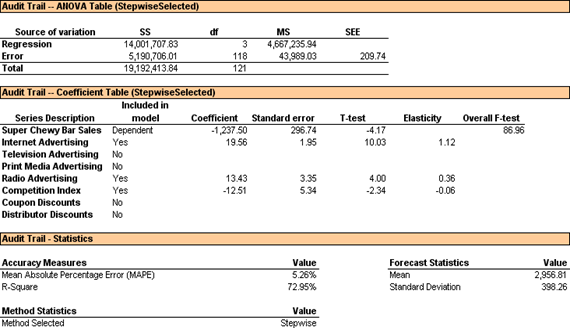
The summary contents show you the forecast has a Mean Absolute Percentage Error of 5.26%. Further down the report, you notice the Coefficient Table. Each series is listed in the left-hand column.
After most of the series, there is a Lag amount in parenthesis. This signifies there is a Lag dependency in the series. For this example, the Lag represents the days (independent series) it takes for the advertising method to affect the sales production (dependent series). For example, Print Media Advertising has Lag 1 following it. This means that the Print Media Advertising method does not have a direct effect on the sales production until after 1 day.
One column over, you can see the independent variables ForecastX included in your regression model: Internet Advertising, Radio Advertising and the Competition Index. As you notice from the T-test and F-Test, the most significant independent variable is Internet advertising. This is easy to notice since the largest T-Test and F-test represent the most significant independent variable.
You can now confidently assert that Internet Advertising is having the most effect on your Super Chewy Bar sales.