
In this increasingly complex and uncertain world, making the tools we use simple yet effective is an imperative. Part of accomplishing this is to be able to calculate what-if or simulation scenarios in a simple and effective way. Fortunately, that’s just what’s happening with eS&OP, when done properly. Keep in mind that making things SIMPLE is not EASY. Ask the Lean folks.
Scenario analysis, as part of eS&OP, considers alternative plans, determining their varying impact on both resource capability and financial consequences. The Visualization figure 1 shows the logical determination of a volume Supply Plan derived from the VOLUME demand projection (forecast) and in turn calculates a RCRP (Rough Cut Resource Plan) for both resource capability and financial consequences (without full granularity). This is done through Simplifying Assumptions.
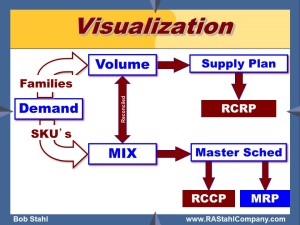 Fig. 1
Simplifying Assumptions about MIX come from mined historical data that allows valid conversion assumptions (without full granularity) to be made that translates projected volume:
- From Market Facing Families in units to Production Facing Families in units
- From Market Facing Families in units to Revenue projections
- From Production Facing Families in units to hours of production
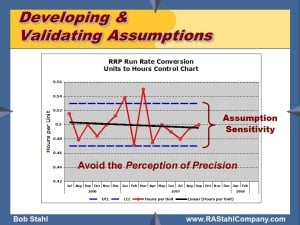 Fig. 2
Each simplifying assumption must be developed and then maintained every month through the use of a traditional Six-Sigma Control Chart – an example is shown in figure 2. The example shown allows the conversion of units of production to hours of production. While there is intrinsic variability, forecasting with more granular data only obtains a “perception of precision” and not real improvement. Keep in mind that with rapid simulation, you can test the assumption sensitivity by going to the calculated Upper and Lower Control limits of variability.
An example: Let’s assume you make a fire retardant chemical product, with varying chemistries that run on one of three (3) reactor trains. The products produced (perhaps hundreds) serve three (3) markets: Automotive, Furniture, and Electronic. eS&OP volume forecasting is by markets so that it can be tracked to market trends and patterns. That volume must then be converted to the load on each reactor train. That’s where the simplifying assumptions come in.
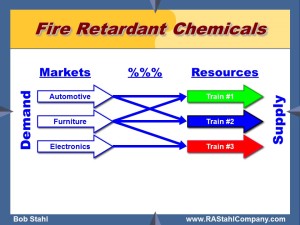 Fig. 3
All of this gets to a simple display for each reactors train that answers three questions:
- What have we been doing (demonstrated capacity)?
- What do we need, derived from the demand volume forecast?
- What do we have to change?
Figure 4 labeled RCRP displays this in graphical form that makes it easier to gain a collaborative consensus.
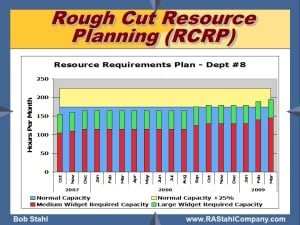 Fig. 4
Due to this simplicity, what-if and simulation analysis can be done in real time, during a meeting or discussion. This is a real boon to achieving a collegial, cross-functional, collaborative consensus about balancing demand and supply and raising positive aligned energy.
Learn more about Rough Cut Planning and Master Scheduling with the Atlas Planning Suite.


